Contents
- Five stars is a compression algorithm
- Read the noun before the sentiment
- Ratings do not tell the full story
- Frequency is useful. Concentration is better.
- The red thread
- Velocity and history are different measurements
- The market vocabulary is sitting in plain sight
- Build a market pain map
- The best finding changes the business
- Reviews are reputation and research
- Methodology note
- Sources
I.
Five stars is a compression algorithm
Two businesses can both show a 4.6-star average and still occupy completely different competitive positions. One may be praised for speed and criticized for communication; another may be praised for communication and criticized for price. The average compresses those dimensions into one scalar.
Google says review count and positive ratings can help local ranking, and Google publicly displays review scores, top reviews and total review count.[1][2] But the text contains a second layer of information: the service, attribute, complaint, praise, timing, employee, location and outcome the customer chose to mention.
II.
Read the noun before the sentiment
A shallow system asks whether the review is positive or negative. A useful system asks positive or negative about what. “Great company” and “the technician arrived within 30 minutes on Sunday and restored our heat” are both positive, but only the second supplies operational evidence.
That review can be represented as structured relationships: the customer purchased a furnace repair; the technician arrived within 30 minutes; the service occurred on a Sunday; the repair restored the heat. When similar relationships repeat across many independent reviews, the analyst has a theme worth investigating.
Illustration — process diagram, not measured data
III.
Ratings do not tell the full story
Cornell researchers analyzing 5,830 hotel reviews across 57 hotels found that aggregate ratings did not fully capture what guests expressed in the review text, and that negative comments could carry disproportionate weight in overall evaluations.[3] The industry is different from local home services, but the measurement lesson transfers: text preserves dimensions that the average cannot.
IV.
Frequency is useful. Concentration is better.
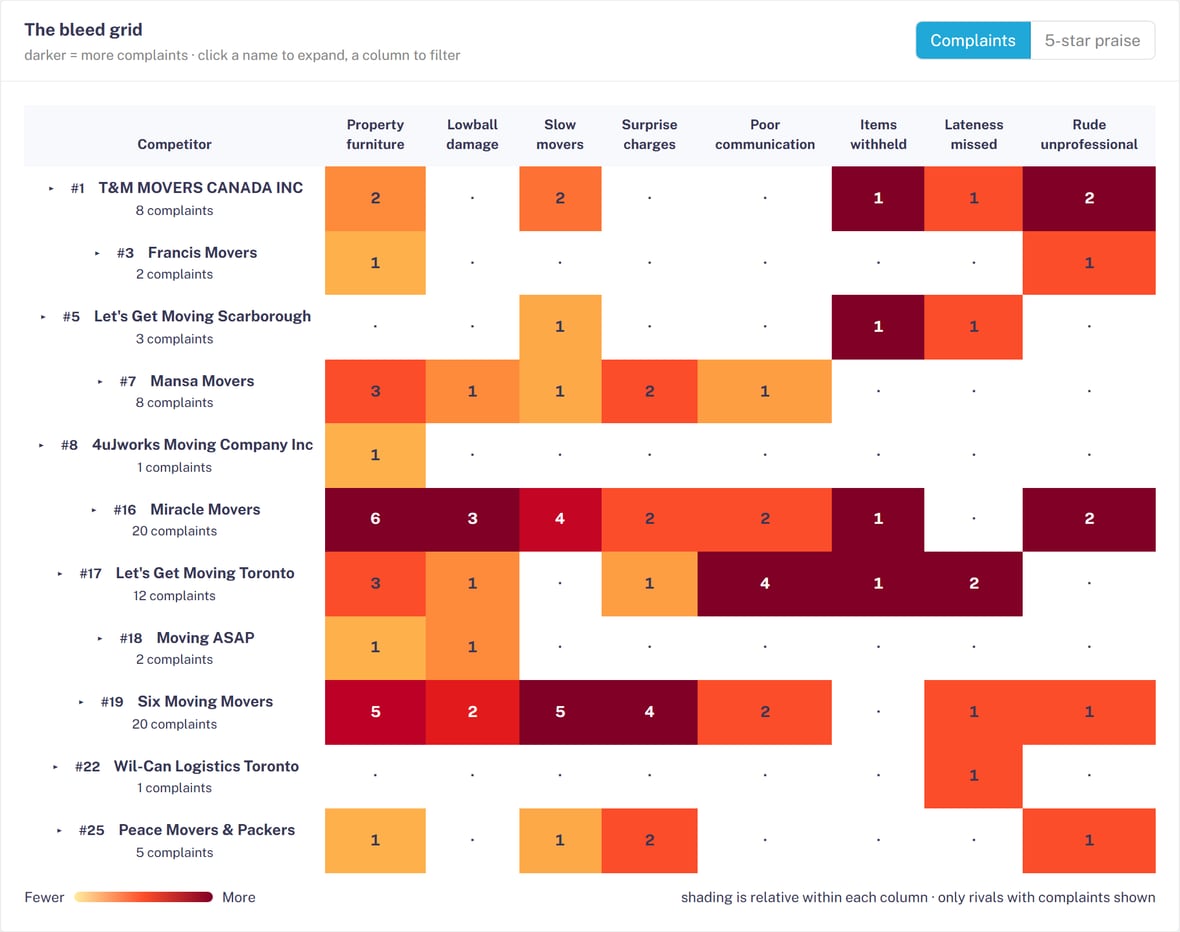
If “late” appears 180 times, the total matters. But the stronger question is how those 180 mentions are distributed. If 150 belong to one competitor, that is a competitor-specific weakness. If the mentions are distributed across the whole market, it may be a market-level pain point. Always examine both raw volume and normalized concentration — and never compare businesses of radically different review volumes using raw counts alone.
A complaint that belongs to one competitor is a wedge. A complaint that belongs to the whole market is an open lane.
V.
The red thread
Treat a complaint as a red thread only when it survives multiple checks: it repeats, it appears across enough independent reviews to be more than an anecdote, the evidence is recent enough to matter, and the market has not convincingly solved it. The correct output is a hypothesis for positioning or operations, not an automatic conclusion about demand.
VI.
Review velocity and review history are different measurements
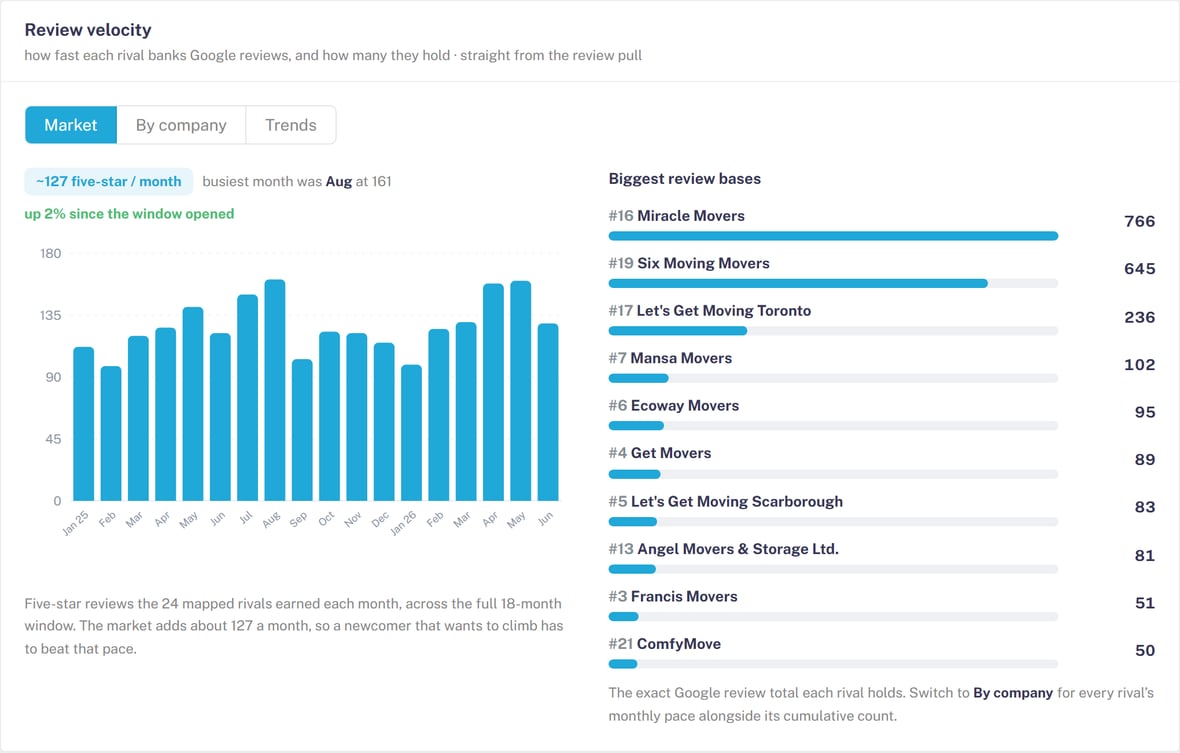
A business with thousands of lifetime reviews but little recent activity is different from a smaller business accumulating reviews rapidly. Total review base describes accumulated reputation. A time series describes current review activity. Preserve both rather than collapsing them into one number — and read the pattern for periods or competitors that deserve closer analysis, not for causation it cannot establish.
VII.
The market vocabulary is sitting in plain sight
Review text also reveals how customers describe the problem when the business is not writing the copy. A clinic may write “endodontic treatment” while customers write “unbearable tooth pain.” A mover may write “residential relocation” while customers write “moving out of my apartment.” The business taxonomy and customer taxonomy are both useful. Review text gives direct access to the second.
VIII.
Build a market pain map
For every recurring theme, record: positive mentions, negative mentions, total mentions, competitors affected, recency, concentration, representative evidence, operational response available and content response available. Then classify the pattern: market-wide pain, competitor-specific weakness, category expectation or possible open lane.
This is the workflow GroundTruth runs as an instrument: it reads the negative reviews of the top 25 businesses in a niche and city, cross-references local Reddit, and returns the themes, the weakness grid and the gaps — so you can analyze competitor review text as market evidence instead of guessing at it.
IX.
The best finding changes the business
Weak review intelligence produces “customers value communication.” Strong review intelligence produces a falsifiable finding such as: a material share of negative reviews across leading competitors concerns arrival uncertainty, several competitors publish wide arrival windows, and none publicly guarantees a narrower one. That can change dispatch operations, sales scripts, page copy and proof. This is why review analysis belongs upstream of content production — and why the Engine takes measured evidence like this and turns it into prioritized actions rather than a content calendar.
X.
Reviews are reputation and research
Google’s local guidance connects reviews to prominence.[1] Cornell’s research shows why the underlying text deserves analysis beyond the average.[3] Harvard research on online reviews shows that reputation information can affect consumer decisions and business outcomes.[4] Reviews therefore have at least three jobs: ranking and reputation signal, conversion evidence, and market dataset. Most operators only run the first job. The context for why prominence matters at all is in the 2026 field manual.
XI.
Methodology note
Every public GroundTruth study discloses business count, review count, rating range collected, time window, date collected, source platforms, deduplication, theme classification, normalization and limitations. Provenance is preserved for quoted evidence, and Google’s policies for review integrity are followed. Sample statistics are meaningful only with their denominator: “238 complaints” means something only with the business count, review count and time window attached.
Sources
Claims about how Google treats reviews are cited to Google. The text-analytics research is cited to Cornell and Harvard directly. First-party GroundTruth evidence is presented as DecodeLocal measurement, never disguised as external consensus.
- Google Business Profile Help, “Tips to improve your local ranking on Google.” https://support.google.com/business/answer/7091?hl=en-CA
- Google Business Profile Help, “Understand review scores.” https://support.google.com/business/answer/4801187?hl=en
- Cornell University, “What Guests Really Think of Your Hotel: Text Analytics of Online Customer Reviews.” https://ecommons.cornell.edu/items/658a3400-e42f-4be9-b5ac-c25e1bc36efd
- Harvard Business School, research on reviews, reputation and consumer response (Yelp research portal). https://www.library.hbs.edu/working-knowledge/the-yelp-factor-are-consumer-reviews-good-for-business